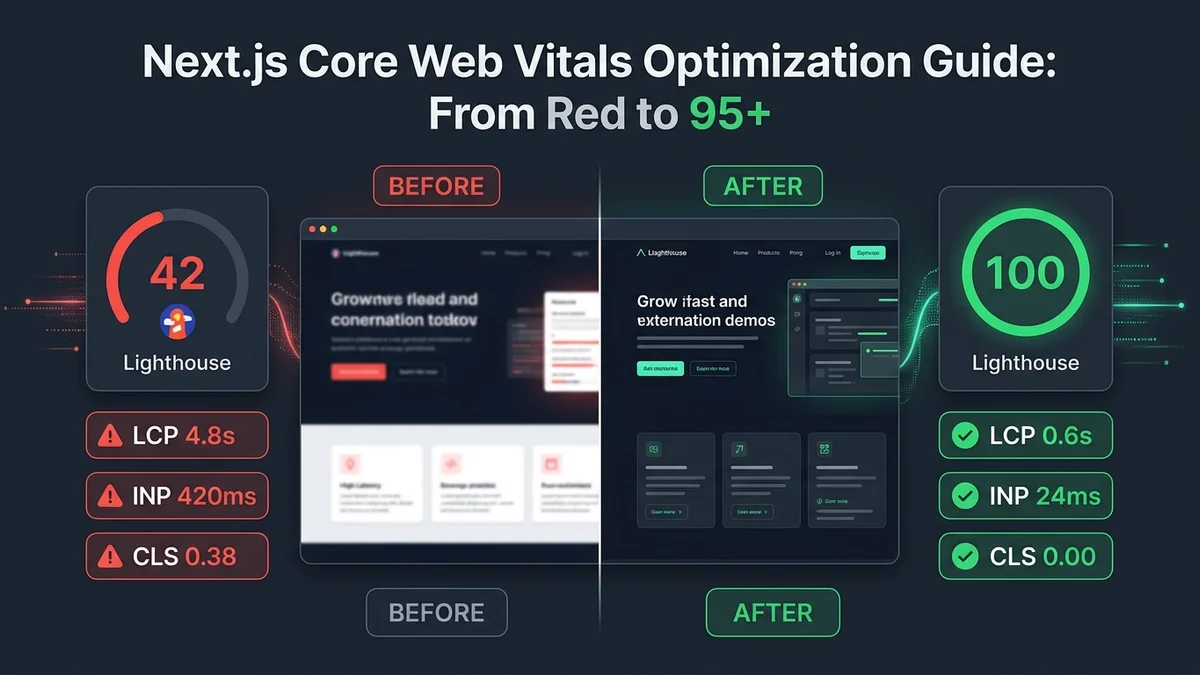
Here are three numbers from real rescues, because abstract performance advice is worthless without them: an e-commerce client whose lead-gen page sat at LCP 4.8s and converted at 1.9%; the same page at LCP 2.1s after one sprint of asset work, converting at 3.4%; and a SaaS dashboard whose support tickets dropped 30% after an INP fix that changed no visual design at all. Speed is not an engineering vanity metric. It is the conversion rate, the support load, and — since Google folded these metrics into ranking — the traffic itself.
The wrinkle, and the reason this article exists: Core Web Vitals in a Next.js app are not one discipline but three, each with its own failure patterns and its own measurement traps. LCP punishes your assets, INP punishes your JavaScript, CLS punishes your layout assumptions. Teams that treat "performance" as one blurry problem fix none of them; teams that separate the three fix all of them quickly, because each metric has a short list of real causes.
Everything below comes from production debugging — this portfolio, client builds, and the education demanded by a career of inheriting other people's slow sites. The stack is Next.js App Router, though every principle survives the framework.
LCP: the metric most teams optimize backwards
LCP measures when the largest contentful element finishes painting — usually the hero image, sometimes a huge heading, occasionally a hero video's poster. The optimization instinct most people bring from page-speed folklore is "setTimeout the hero" — defer everything non-essential — and it is precisely backwards for LCP, which wants the opposite: make the big element arrive first, and deprioritize everything else around it.
The fixes that actually move the number:
- Format and size the hero honestly. AVIF or WebP at the rendered size — not the captured size. The screenshot-sized-but-displayed-small pattern sends phones the same 400 KB a desktop would use. In Next.js:
<Image>with a correctsizesattribute; manual<picture>with explicit AVIF/WebP sources for hero art where you need art direction. - Priority flags with intent. The visible hero gets
priority(orfetchpriority="high") and is never lazy-loaded; nothing else on the page competes for the critical path. The single most common LCP sin I find in audits isloading="lazy"on the one image LCP is measuring. - Kill the font that holds the headline hostage. Render-blocking font CSS plus invisible-while-loading text is a double penalty:
next/fontwithdisplay: swap, only used weights. One client was loading eight font families to render two weights. - Shortcut the server, not the design. If TTFB dominates the LCP budget, the wrong fix is image compression; the right one is server work — static generation or ISR instead of per-request DB reads, database query for first paint moved behind Suspense, edge caching where legal.
The measurement discipline for LCP has a subtlety that wastes whole audits when missed: the LCP element can change. Debug in production with the real field data (Chrome UX report in Search Console plus the web-vitals library feeding your analytics with attribution), and check the reported element — a page you assumed was image-LCP may actually be text-LCP after a font appears late, and the fixes differ completely.
INP: the metric hydration kills
INP (Interaction to Next Paint) replaced FID in March 2024 and immediately exposed a class of site FID never saw: pages whose first input was fine but whose typical interactions stutter. INP watches every interaction across a visit and judges you by the worst (well, near-worst — 98th percentile-ish). A page that is snappy for the first click and freezing at the third tap fails.
In Next.js specifically, the dominant cause is hydration plus render work, which decomposes into its usual suspects:
- Client-component sprawl. Every
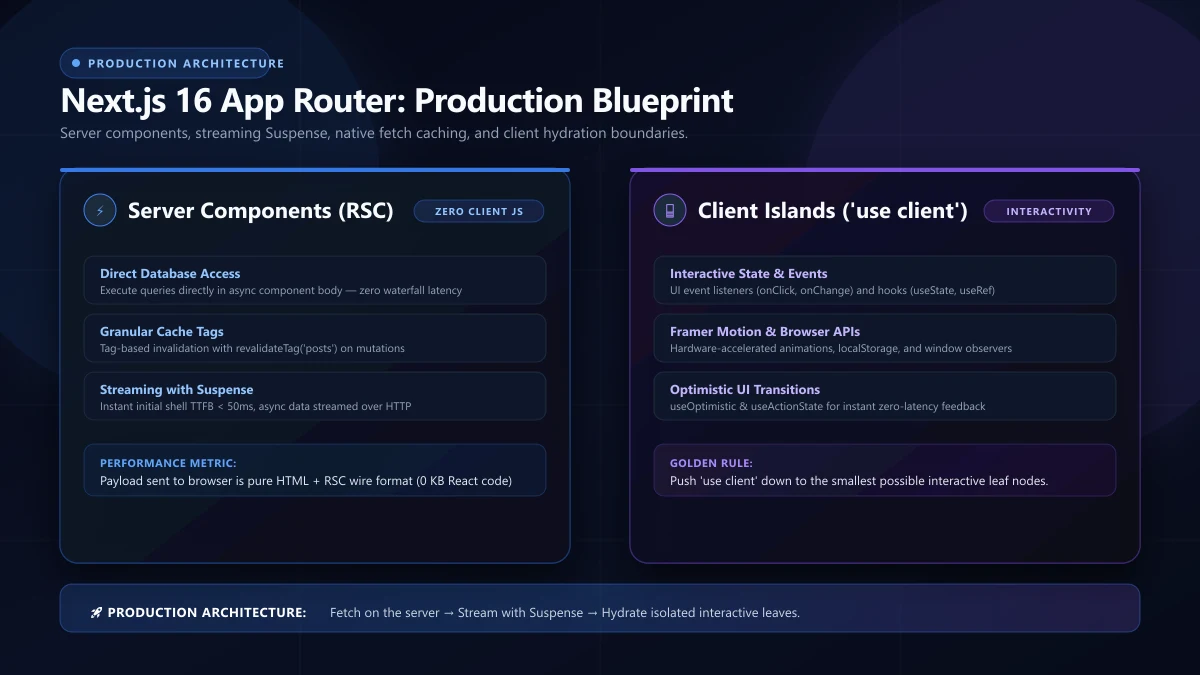
use clientboundary ships JavaScript, parses it, hydrates it, and pays CPU rent. The fix is architectural and covered in my App Router guide: push boundaries to actual interactive leaves. On one dashboard rescue, collapsing client-climbing boundaries cut scripted bundle from 620 KB to 90 KB and INP went from 380ms ("poor") to 140ms with zero behavior change. - Hydration tempo. Hydration work bursts after load; interactions landing exactly there queue behind the burst. Streaming content in (Suspense) and trimming hydration work shortens the vulnerable window rather than making it luck-resistant.
- The expensive click handler. Every per-frame layout read inside a handler (getBoundingClientRect on a table's 200 rows) forces synchronous layout. Batch reads, then writes; virtualize long lists; move sorting and filtering off the main thread with
startTransitionso the input paints before the heavy state update. - Third-party scripts with permission to misbehave. Chat widgets, tag managers, consent platforms. Audit them like debt: every one is another main-thread neighbor. Load what you can after interaction, gate what you can behind consent.
Measurement nuance for INP: lab tools correlate only loosely with field INP because they cannot simulate a mid-range Android under thermal pressure. Use both, with field data as truth: Lighthouse in CI for regressions (it catches the layout-thrash class), CrUX and instrumented web-vitals for the honest percentile. When the two disagree, believe the field — that has been right every single time.
CLS: the metric of design process failures
CLS (Cumulative Layout Shift) is less about engineering craft and more about what the team agreed the layout would be while it loads. The causes are boring and highly preventable:
- Media without reserved space. Every
<img>and<iframe>needs explicit dimensions or anaspect-ratiobox. This one habit plus nothing else usually takes CLS from red to green, because images resizing-into-place is the largest contributor in most audits I see. - The consent banner injection. The banner slides in and pushes content, and even "just the first dismissal" counts. Reserving space ahead of hydration (skeleton) or overlaying without reflow solves it; shipping the wishbone-off-and-hoping does not.
- Font metric mismatch. The fallback font loads, then the swap repaints every paragraph at a new width, and the page shivers.
size-adjust/adjacent fallback metrics fix the width deltas;next/fontdoes this automatically now. - Late-arriving content above the fold — inserting ad slots, cookie overrides, or streamed sections above existing text. Reserve space or append; never insert above what the user already reads.
One audit trap worth naming: debugging CLS from a local dev environment is nearly useless — the shift pattern depends on real cache states. I record sessions on production with the Layout Instability API in devtools, replaying on throttled CPU, and fix from those recordings.
The budget, and keeping it
Point fixes decay. The sustainable shape is a budget plus a gate: JavaScript shipped per route (initial and total), LCP/INP/CLS targets per template, image weight per page. Wire the budget into CI (Lighthouse CI against a staging build) and alert on drift from field data. The economic argument beats the moral one: every metric on this list correlates with revenue or retention in published studies and my own dashboards, so a week of budget discipline is paid back the first time it prevents a 400 KB hero from re-appearing on three marketing pages at once.
Reducing this to a sprint, in priority order of impact-per-effort: hero image format and priority; font loading hygiene; use client audit down to interactive leaves; explicit dimensions everywhere; virtualize long lists; third-party script audit; caching review; then measurement to hold the line. Two days of focus, one sustained Lighthouse patrol, and a field-data graph that stops embarrassing you in stakeholder meetings.
Interactive FAQ
"Lighthouse says 98 in CI, field data says LCP is poor. Why?" Lab-vs-field gap, the classic. Lab runs from datacenter broadband on a fast CPU; field data includes your median user's device and carrier. Forward-fix the gap by shipping web-vitals attribution to analytics and diagnosing from the real LCP element distribution — never by re-tuning to the lab number.
"Does Core Web Vitals affect my SEO?" Yes, as one input among many — and the practical effect is compounding: the same fixes (smaller payloads, faster HTML) also improve crawl efficiency and mobile usability, which have their own ranking weight. Treat CWV as one pillar of a technical SEO program, not as a solo play.
"My app is a dashboard behind auth — do CWV matter?" Users are less forgiving behind auth, not more, because they pay the speed price daily. Optimize INP first for such products; it is where the daily annoyance lives.
"Which metric do I fix first?" Whichever field data flags as failing for the highest-traffic template — usually LCP for marketing pages, INP for app pages. One template at a time, shipped end to end, beats three half-fixes across the site.
Image loading patterns beyond the hero
The hero gets the attention, but a full performance program treats every image class differently — I want that taxonomy written down, because applying hero-tactics to thumbnails is how performance budgets die quietly through doing the "right things":
- Above-the-fold hero: AVIF, priority, explicit dimensions, preload if the framework needs it. Correct, settled, covered above.
- Below-the-fold content images: lazy-load by default with root-margin, sized via
sizesso mobile never downloads desktop dimensions. AVIF/WebP as sources; do not skimp on dimension correctness — genuinely sized assets fix both bandwidth and CLS in one move. - Carousels and galleries: lazy-load slides N+1, never the whole set. An 8-slide carousel loading all 8 images at mount is a classic budget leak, and prefetching the next slide's smallest variant smooths the swipe without waste.
- Data-driven UI images (portraits, logos, event posters): they live in lists and repeat — cache their URLs, dedupe by id in the fetch layer, and choose rendered sizes from the layout, not the original assets.
- Icons and minimal decoration: inline SVG. HTTP requests for 2 KB icons are round-trips wearing icons as costumes; the inline version also inherits currentColor theming for free.
Also worth stating: the images that should not exist. Audits routinely delete 20–40% of an image program — decorative assets whose entire job could be a gradient, or duplicated social-media crops living in production bundles. Performance audit is also an inventory review; the cheapest bytes are the ones you stop serving.
Third-party scripts: the unfashionable-but-decisive audit
Every performance rescue I have led ended with a third-party conversation, because marketing stacks accrete scripts and never subtract. The audit protocol that keeps the process factual and keeps friendships intact:
- Inventory honestly. Pull the full list from rendered HTML: tag managers, chat, analytics, A/B tools, consent platforms, social pixels. Most teams discover 2–5 scripts nobody can name an owner for.
- Measure each one's cost — network KB, main-thread time, and long tasks it introduces. Tools vary; any profiler makes the cost table factual rather than argumentative.
- Apply the ladder: remove (ownerless), delay until interaction (chat widgets especially), async-and-isolate (what remains), or replace with a lighter alternative. Self-hosting well-behaved scripts also removes round-trips and allows long-lived caching.
- Set rules for the future: every new script needs a named owner and a purpose, reviewed quarterly. Without governance the accretion resumes, and every performance budget conversation becomes a re-litigation.
Consent-aware loading deserves specific attention in 2026: gating analytics to consent is both compliance and performance policy — and the same interplay appears over in my compliance-scanning article as script blocking before banner interaction. One mechanism, two disciplines approving it.
The measuring habit: an ops ritual, not a tool choice
Performance decays through unwatched drift, so the sustainable program is a monitoring cadence rather than a heroic audit:
- CI gate: Lighthouse CI against a representative template set on every release candidate, with a strict failure threshold — no budget negotiation in the middle of a merge.
- Field dashboards: the
web-vitalslibrary with attribution posted to analytics, cut by template and device class, checked weekly. Attribution turns "LCP regressed" into "the hero endpoint on /pricing slowed by 400ms" — the difference between a fix and a hunt. - Alerting on drift: when a template's p75 LCP crosses its budget in the field, a real ticket opens. Drift alerts have caught database-side regressions before users noticed on every product where I installed them.
- Release tagging: correlate vitals against deploy markers so the finger points at releases, not at vague "the internet." Every regression conversation I shorten came from tagging.
Debugging INP — the trace reading that finds real fixes
Advice to "profile the interaction" skips the part that makes profiling useful: what the trace should reveal, in order. When INP field data flags a template, I reproduce the flagged interaction in DevTools performance recording and read the trace for four specific things:
- Long tasks after the input — the handler and everything its state enqueue. The task's self-time versus its children's time separates your code from library code nearly instantly.
- Style-recalculation volume — large batched recalcs after a handler usually mean class-soup on big trees; scoping changes (removing a data-attribute hack that re-styles an entire list) routinely undo half of a bad INP by themselves.
- Forced synchronous layout — alternating read/write patterns appear as purple recalc-warning stripes. This is a pattern code review can also catch — layout reads inside click handlers are on my personal PR checklist.
- Hydration overlap — the interaction landing inside a hydration burst frame tells you your vulnerability window needs shrinking (streaming, boundary diet), not just handler slimming.
INP repairs are unusually satisfying because feedback is immediate in both lab and field — unlike SEO moves, you re-record the interaction and the number actually moves, closing the loop inside a single morning instead of a quarter.
One habit made the biggest measurable difference: I stopped chasing individual metric scores and started charting distributions. A dashboard showing 75th percentile LCP tells you almost nothing useful by itself; the interesting questions are how that number moved after each release and whether the tail, the worst five percent of sessions, improved or got worse. Medians flatter, tails punish, and users live in the tail far more often than a green dashboard admits.
Another honest observation: most Next.js performance wins are boring. Narrowing a client boundary, fixing a font loader, setting correct cache headers — none of it makes for exciting code review, and all of it compounds. The dramatic rewrites, the ones that felt clever while writing them, produced the smallest measurable gains of anything on this list. If that pattern holds in your codebase, trust it, and spend the refactoring budget on the dull fixes first.
On tooling, one practical rule beats any elaborate setup: measure in the field, not just the lab. Lab numbers measured on a fast laptop over fast wifi miss what most of a real audience experiences, so field data collection has to keep running even when lab scores look spotless. Every optimization worth shipping gets verified against field numbers, before and after the change, because the only metric that actually pays is what real visitors on real devices received in the end.
This portfolio's numbers are the proof-of-work, measured on field data: run it yourself. Need performance work or an audit sprint for a Next.js product? See services or book a pass.